A balance sheet is a financial statement that lists an organization’s assets, liabilities and shareholders’ equity. It presents the financial standing of a company at one point in time. This statement can give an overview of how strong a company is in terms of its assets to pay off its liabilities. This information can be used by the company to have an understanding of where it stands as well as for the stakeholders or investors to evaluate investment opportunities.
Therefore, a balance sheet is maintained by almost all the companies, especially the listed ones, as it is one of the requirements of accounting standards which organizations have to adhere to. As it is a tiresome task to keep a record of all the assets and liabilities, companies usually utilize MS Excel balance Sheet template for this purpose. This template eases the financial analysis as well due to the generated graphs and charts.
Download
[For Excel: xlsx & Polaris Office] [Size: 173 KB]
OTHER OPTIONS
Download
[OpenDocument Spreadsheet .ods] [Size: 84 KB]
What is a balance sheet template?
A balance sheet template is a spreadsheet of MS Excel which is widely used by the companies to keep a record of their data. It records and tracks information with reference to the assets (both current and long-term), liabilities (both current and long-term) and shareholders’ equity. The template can record the data of a number of years and hence a comparison of the figures of different years is possible as well.
Usually, one sheet is assigned to the assets which list down all the assets along with their required information. The sheet presents the segregated assets with the general categories of current assets, fixed assets and other assets (that may include goodwill).
Another sheet is assigned to record the data of liabilities and owners’ equity. The general categories include current liabilities, long-term liabilities, and owners’ equity. This sheet has all the detailed and required data under these categories for various years.
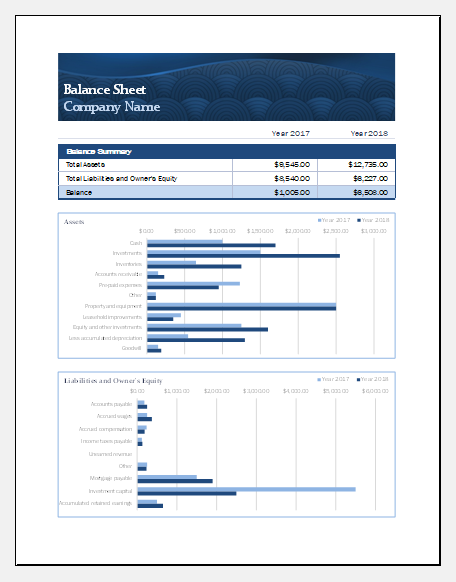
The third sheet is dedicated to present the overall picture with the automatically calculated figures along with the auto-generated charts and graphs for the financial analysis. This sheet shows the figure of total assets and total liabilities with the owners’ equity. Idealistically, the two figures should match but, in reality, often discrepancies are found for which the template has a field with the name ‘balance’ which indicates any difference between the two figures which should have matched otherwise. In addition, this sheet has graphs that highlight comparisons of assets, liabilities and owners’ equity over years.
How to use the balance sheet template?
A very easy to use MS Excel spreadsheet can be readily downloaded and customized as per the requirements of the companies. Once all the categories and fields have been customized and updated, the company can use it conveniently. Customization need not be a one-time thing; the changes can be made on a continuous basis.
The accounts department has to fill in the fields of assets, liabilities and owners’ equity. This is the main task that requires only data entry, the template will automatically do the rest. As the template has inbuilt formulas, the totals of the sub-categories stated in the sheets will be automatically calculated. In addition, the ‘Summary’ sheet will automatically calculate the total assets, total liabilities and owners’ equity along with any balance of discrepancy for a period.
In addition, the summary sheet would generate graphs that will allow a comparison of assets and liabilities and owners’ equity over different years. If a company needs any particular graph with a special focus on certain assets over a few years, for example, the template will generate that as well. This information and graphs can be utilized for financial analysis purposes. The balance sheet information and graphs can be easily printed as well.
Benefits of the balance sheet template
The template offers a number of benefits which is why it is often opted for by the companies. Some of the benefits are:
- It saves time, cost and effort of the company.
- It is easy to download and customize.
- The template makes the recording and tracking of data and information easy.
- The inbuilt formulas ease the task of the accounting department as well as minimizes the chances of human error in calculations.
- In a glance, detailed information about assets, liabilities and owners’ equity can be viewed.
- The summation of figures can be looked at to get an overview of the company’s financial position quickly.
- The information in different categories and sub-categories can be utilized for analysis and comparison purposes.
- The trend in discrepancies highlighted by the remaining balance between the total of assets, liabilities and shareholders’ equity can help the companies figure out the issue and improve the balancing.
- The generated graphs can be utilized for the financial analysis and present the overall financial standing of the company.
- Different graphs can be generated and printed.
The companies find it useful to utilize this template for maintaining their balance sheet which is why it is widely used.
We hope that this article and the attached template will provide all the guidance required for managing your balance sheet. Feel free to contact us for any further questions. Also, please write to us and provide us with your feedback. Thank you!