The profit and loss statement is a financial statement of a company that shows details of its revenues, revenue related costs, expenses, and net income or net loss for a specific period of time. This statement holds significance for the company, shareholders, stakeholders including any potential investors. Therefore, maintaining and keeping proper records are important for a correct profit and loss statement. This task sometimes becomes complex and tiresome, especially, for big businesses that have different sources of revenues, varying expenses and incomes/losses of different sister companies.
The MS Excel template for the profit and loss statement becomes the savior and helps the organizations in managing their financial statement not just over one month or a year but over several years.
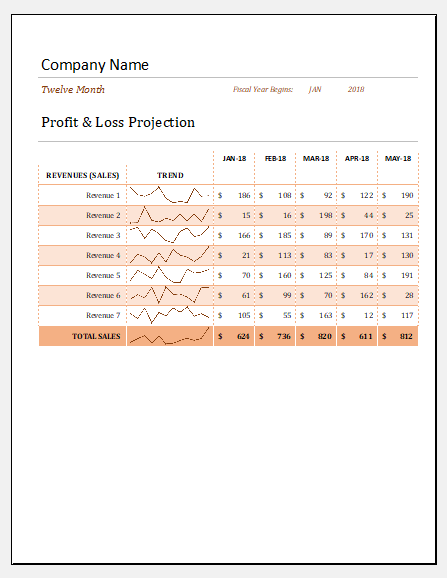
What is a profit and loss statement template?
It is an MS Excel spreadsheet to record and keep a track of all the data pertinent to the profit and loss statement. It is a predesigned template that has built-in formulas. The template is easily customizable which makes it suitable for almost all kinds of organizations.
It not only has detailed fields for recording data of revenues, cost of sales, expenses and income/loss calculations but also, the built-in formulas allow automatic calculations of fields that include the percentage changes over years or months. Therefore, this template can easily be filled in and the patterns can be observed as well for making any kind of financial analysis.
Download
[For Excel: xlsx & Polaris Office] [Size: 51.0 KB]
OTHER OPTIONS
Download
[OpenDocument Spreadsheet .ods] [Size: 32 KB]
How to use the profit and loss statement template?
This MS Excel template is very easy to use. You just have to download it and customize it based on your needs and requirements. Once you have all the required fields, the data can be filled in.
If a monthly income-statement is being made by the company for internal purposes, the monthly figures of sales, cost of sales and expenses are filled in. The same procedure is applicable to the yearly statements.
The built-in formulas then calculate the figure for profits or losses. The built-in formulas not just calculate the profit/loss figures. Rather, you can see the automatically calculated cost of sales by inputting figures of purchases, opening stock and closing stock.
The closing stock of the previous month or year would automatically become the opening stock of the next year. In addition, this template lets you see the percentage changes over periods for different fields. When you put in the data, the percentages will automatically be calculated through the built-in formulas and the automatic generation of trends is also visible.
The template allows calculation of gross profit as well as net profit. When you will enter figures for revenues and cost of sales, gross profit or gross loss figure would appear. Then, when you will add the expenses data in the template, it would generate the figure of net profit or net loss automatically.
This template can also be used if you want to generate any other graphs using the data. If you want to include any additional information, a column of notes can be added. It can easily be printed as well.
Benefits of profit and loss statement template
There are many advantages to using this template. Some of which are explained below:
- It is a template that can easily be customized, updated and used.
- It provides a summary of sales, cost of sales, expenses, and generation of profit or a loss over a period.
- It aids in maintaining and recording the required data.
- It saves time and effort.
- As it is a professional template, the built-in formulas are correct that helps in providing accurate calculations.
- It highlights the areas that need attention. For instance, a continuous increase in a certain expense can be highlighted so that prompt action can be taken. Likewise, a loss figure is highlighted so that the managers can work on the whys and take required and timely action.
- The month wise percentage changes show the patterns and months of significance. For instance, if the March sales have increased from last month’s sales and fell again in April, it shows that March proved to be a good revenue generation month. The trends can also be seen in the automatically generated trend graphs. These patterns and trends can be utilized for financial analysis purposes.
Due to its ease of use and associated benefits, the template for profit and loss statement is widely used by the businesses.
We hope that this article and the template will help in recording and tracking your company’s data of profit and loss statement. If you have any questions or queries, please write to us and give us your feedback. Thank you!